
Vancouver Housing Report
November 2024
Author: Jaime Pantoja
This report explores the Vancouver real estate market, offering insights into pricing trends, property distributions, and market dynamics. Leveraging a cleaned dataset of 800 observations sourced from Zillow (filtered from over 4,000 property listings), this study employs a range of data science techniques to uncover actionable insights and answer key business questions.
The analysis includes robust data preparation steps, such as cleaning inconsistent property size formats and handling missing values, ensuring the dataset is accurate and reliable. Using statistical analysis and advanced visualization techniques (e.g., heatmaps, scatter plots, and distribution graphs), this report addresses the following critical questions for stakeholders:
- What are the current pricing trends across different property types in Vancouver?
- How do geographic locations influence property prices?
- How can this information guide strategic decision-making for buyers, sellers, and real estate investors?
This project uses Python libraries such as pandas for data manipulation,
matplotlib and seaborn for visualizations, and folium for
geographic data representation. By integrating these tools, the report demonstrates a comprehensive
workflow from data preparation to actionable insights, highlighting both technical capabilities and
real-world applicability.
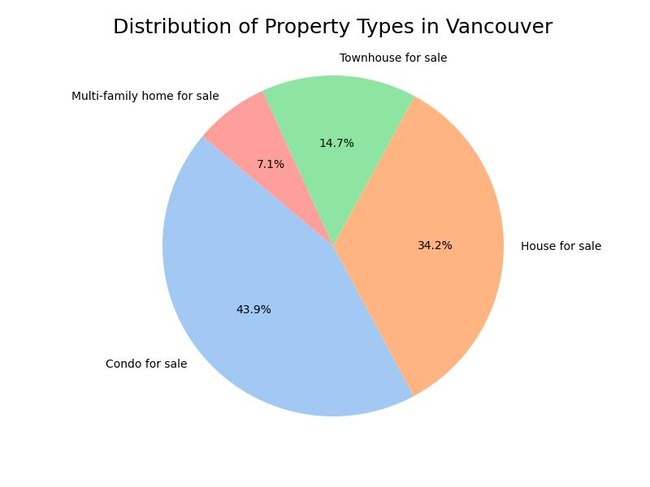
Distribution of Property Types in Vancouver
This section provides an overview of the distribution of the housing market in Vancouver, focusing on properties that are listed for sale. The results come from a representative sample of more than 800 properties out of 4000 listed in Zillow by November 18 of 2024. The data collection used a hybrid approach where only one part was automated, this to align with the terms of use from their website. It is worth noting that the purpose of this report is educational and non-commercial.
The distribution of the housing supply market in Vancouver demonstrates diverse offerings tailored for various types of clients. It is important to notice that condos and homes represent 78% of the housing supply in the market. Condos have the highest participation with 43.9% indicating the highest supply in comparison to the other type of properties. Condos are a housing solution for individuals who preferred the benefits of the urban conveniences like commercial hubs, shopping, public transportation, events, festivals and so on.
Along those lines, the second highest participation is housing representing 34.2%. This percentage highlights other type of preferences, where individuals align better with traditional housing outside of the downtown area. Multi-family homes and townhouses represent the remaining 21% offering additional choices for diverse household needs and preferences.
The distribution of housing raises critical questions, particularly regarding the locations of different property types. These questions can be effectively addressed using geospatial analytical tools, which allow for the visualization of data on maps. Such analysis offers valuable insights for a wide range of market participants, including buyers, real estate agents, and developers. The methods and tools employed for this analysis are outlined in the following section.
of the properties in Vancouver are Condos
Geospatial Insights and Clustering Analysis
This section presents the data from the different types of properties in a map presentation. The first part introduces heatmaps of each one of the property types revealing the areas of higher density for that category. The second part illustrates the results of a clustering machine learning algorithm, where the properties were grouped according to similarities in their location and price.
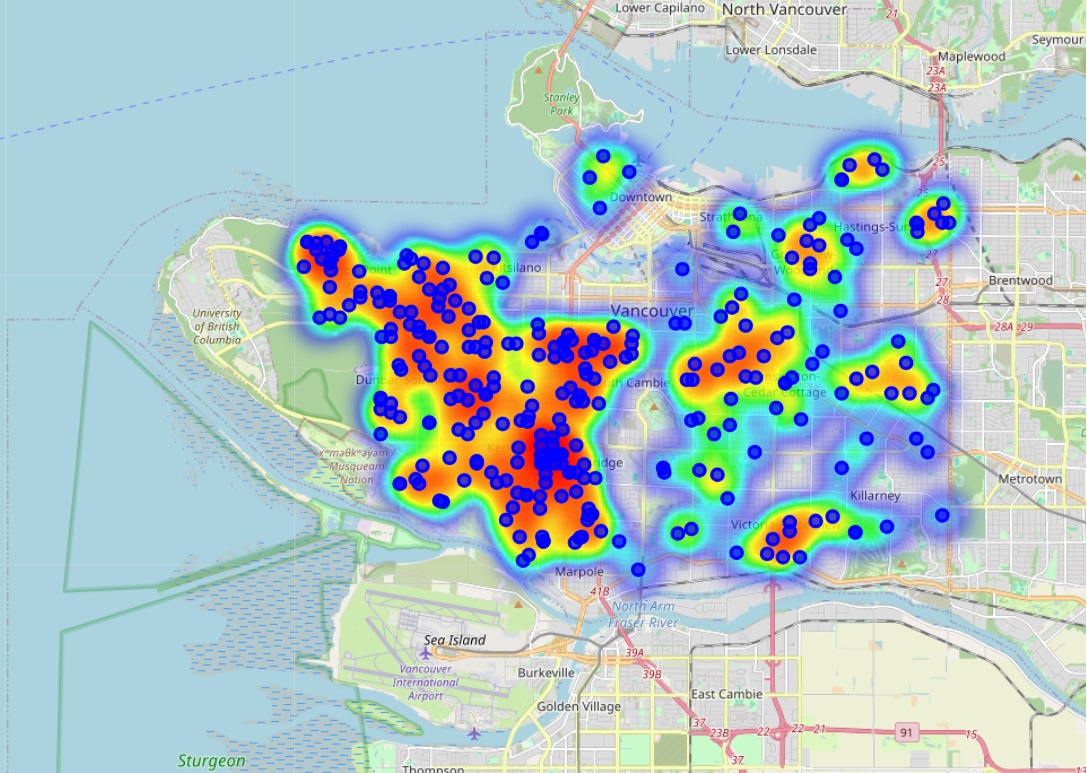
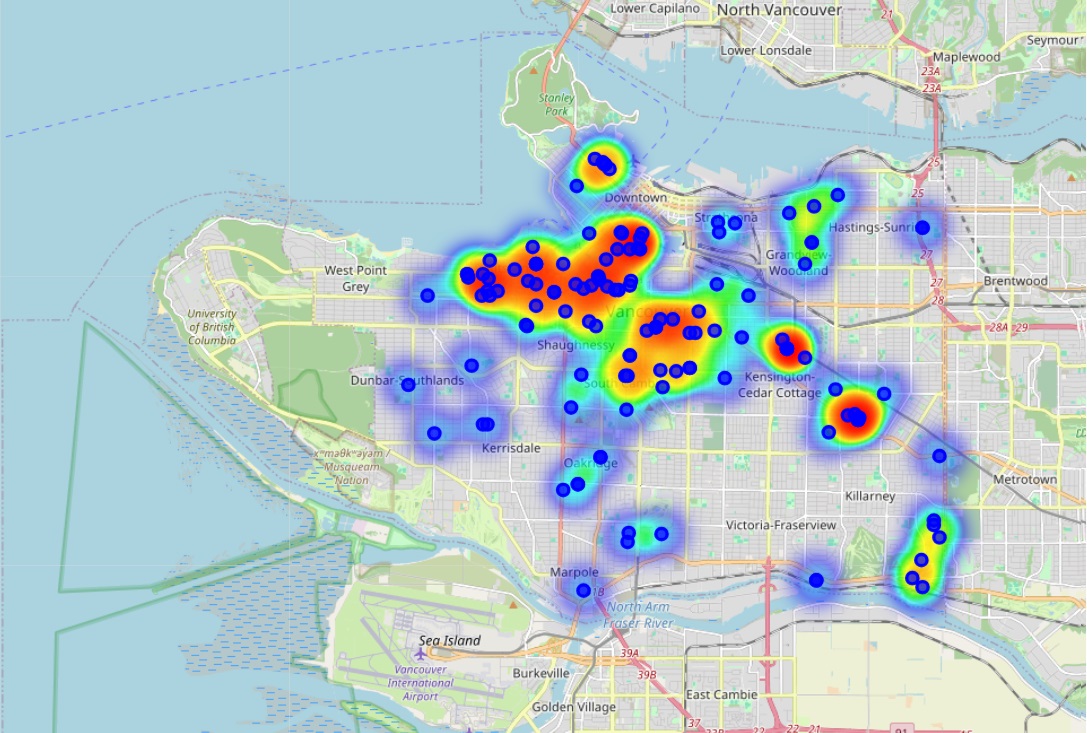
Heat Map by Property Type
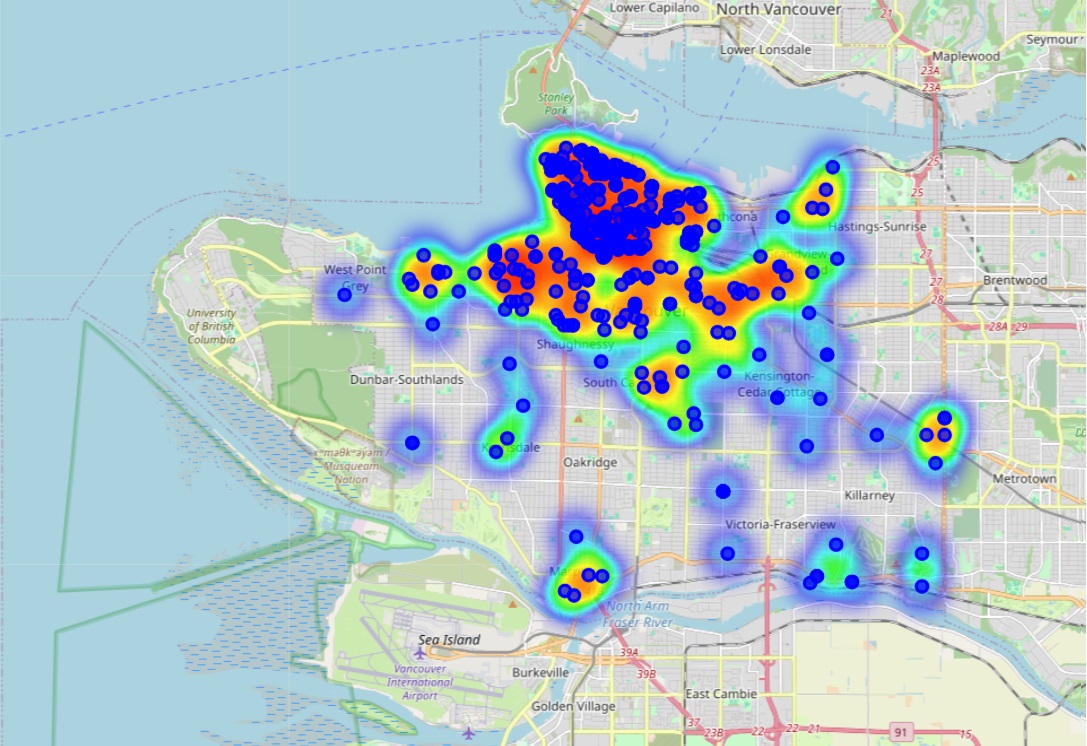
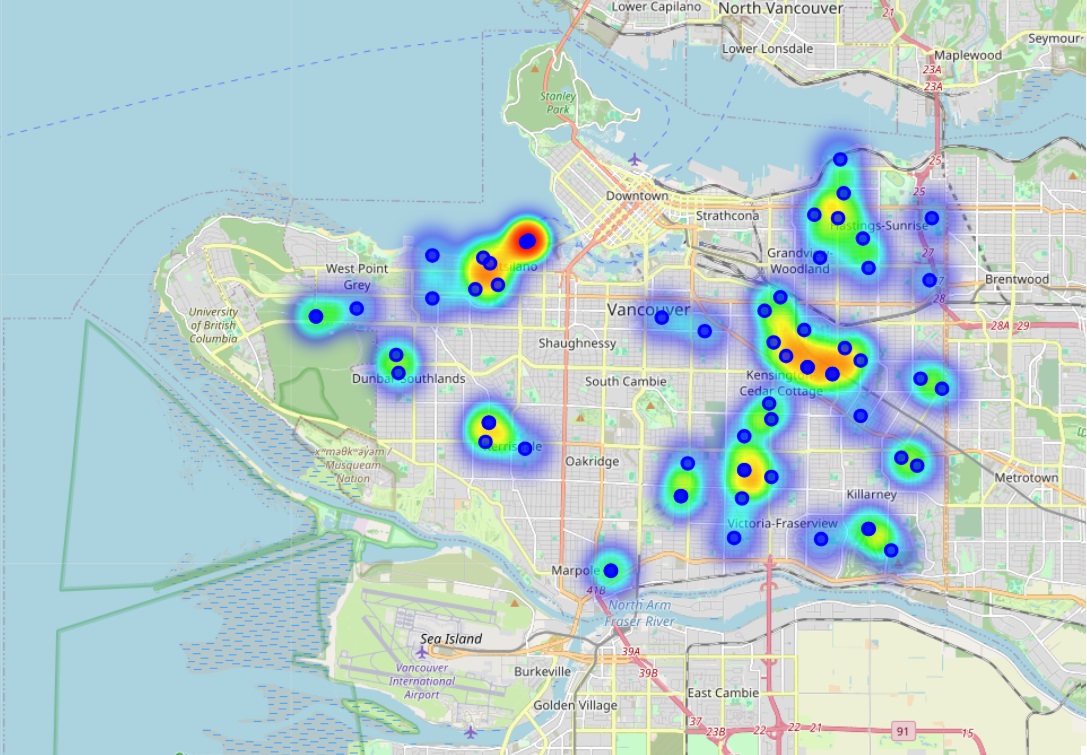
The following heat maps offer insights about the areas where a specific property type has more instances in comparison to others. This information is valuable because provide insights about the market distribution from a location perspective. For example, condos are mostly concentrated around downtown, Coal Harbour and West End. On the other hand, houses are located mostly in areas like West Point Grey, Kitsilano, Arbutus Ridge among others.
This findings are useful for various groups involved in the Vancouver real state scene because enables them to make informed decisions thanks to precise information.
- All
- House Heat Map
- Condo Heat Map
- Multi Family Home Heat Map
- Townhouse Heat Map
Clustering Analysis
The use of clustering algorithms in the field of machine learning enable to group similar data points into clusters that have common characteristics. This technique can be applied to the housing market in Vancouver using the features of location, represented by the latitude and longitude, and price. The results illustrate three clustering groups or zones that share similarities considering their location and price. This technique is useful to identify patterns that are not immediately visible but provide meaningful observations regarding regional trends and dynamics.
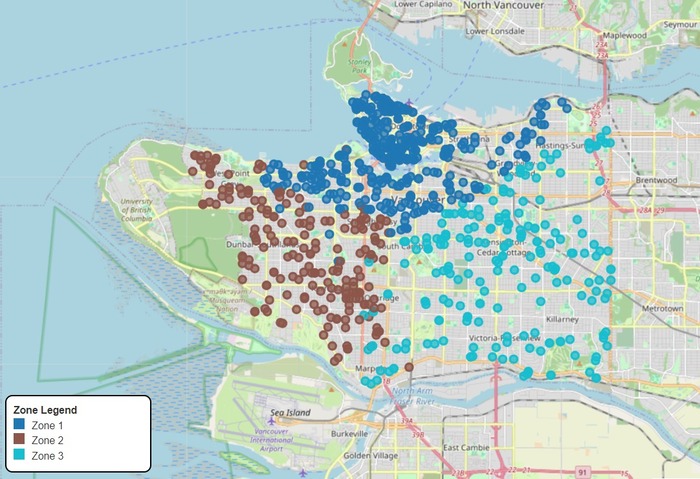
After running the clustering algorithm and mapping the groups, it is clear the presence of three zones that share similar features in terms of location and price. Zone one is located close to downtown whereas zones two and three are located to the south-west and south-east respectively. However, to gain a deeper understanding of what those values represent, it is important to understand the pricing distribution to gain insights of the zones that are being portrayed in the map. The interactive cluster map is accessible through this link
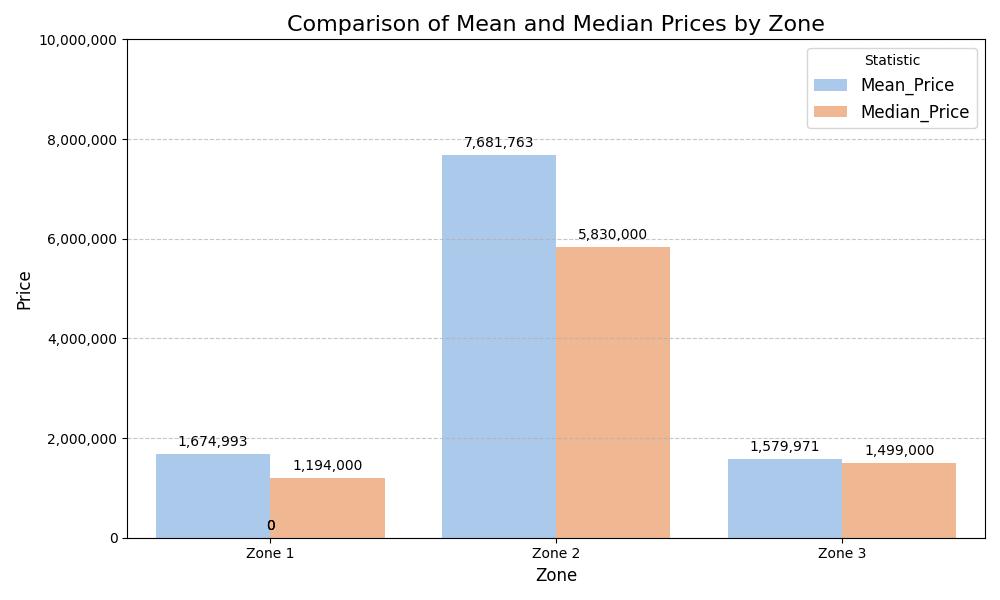
The price distribution across the three zones reveals that Zone 2 has the highest median price, which is 388% and 288% higher than Zone 1 and Zone 3, respectively. This significant disparity can be attributed to Zone 2’s proximity to downtown, historically associated with higher prices due to its prime location, superior infrastructure, abundant amenities, and other factors driving demand.
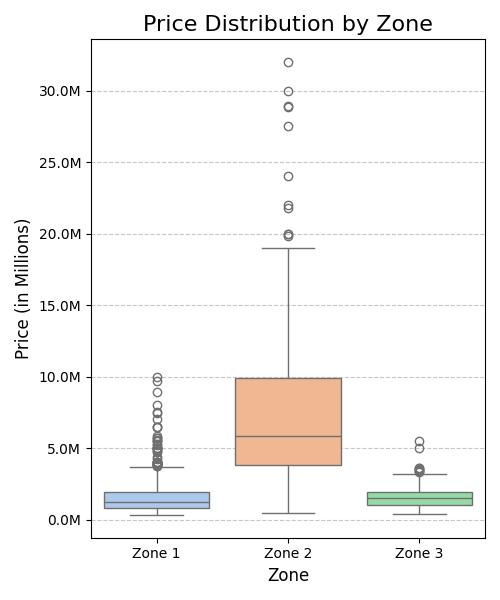
Furthermore, the box plot chart and outlier analysis highlight Zone 2 as the area with the most luxurious properties, including assets listed for approximately 30 million Canadian dollars. Conversely, Zone 3 features properties with maximum prices nearing 5 million Canadian dollars. Zone 1 provides a middle ground, with luxury properties reaching a maximum value of around 10 million Canadian dollars.
It is worth noting that the outlier analysis offers valuable insights into the market dynamics of luxury properties within specific zones. These outlier observations, particularly in Zone 2, underscore the concentration of ultra-high-end properties priced at 10 million Canadian dollars or more.
Pricing Analysis
This section provides an in-depth analysis of pricing distribution across the overall market and individual property types. Pricing dynamics are visualized using histograms, offering clear insights into market trends. Additionally, a clustered bar chart compares key metrics for each property type, enabling a nuanced understanding of their performance within the broader market.
Distribution of Housing Prices
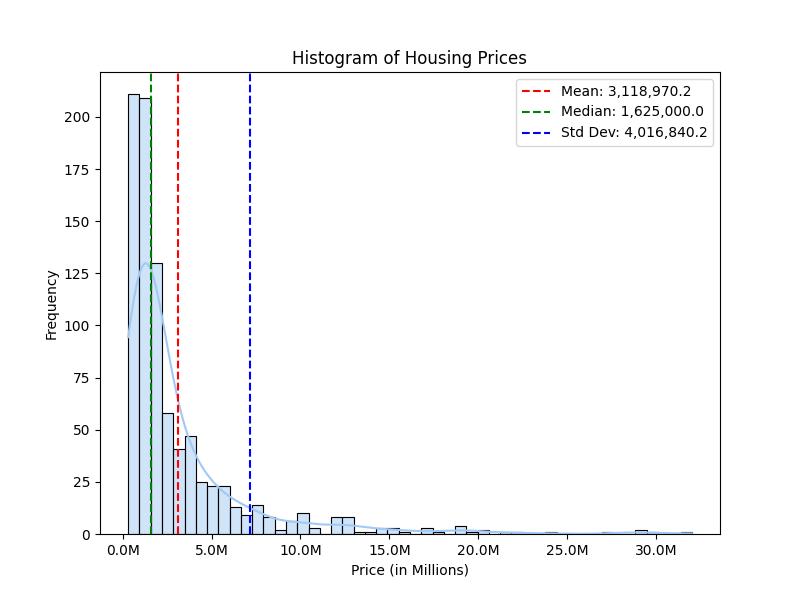
The overall market distribution illustrated by the histogram shows a skewed distribution to the left. This type of shape is common within housing markets due to the existence of expensive properties, particularly in cities with elevated housing costs. The left-skewed distribution indicates that most of the listed properties fall within a relatively ‘affordable’ price range in comparison to luxurious properties.
It is essential to note that the mean can be a less reliable measure of central tendency. This is due to the influence of outliers, such as high-priced luxury properties, which can significantly inflate the mean and shift it away from the bulk of the data. Therefore, the median emerges as a more robust indicator for representing the typical house price in the city, as it remains unaffected by extreme values and provides a more accurate reflection of the central tendency within the dataset.
In this order of ideas, the typical cost of a property in Vancouver, according to the median value, is 1.6 million Canadian dollars. However, the following sections detail the price distribution according to the property type, providing a detailed information about the market dynamics.
Housing Prices by Property Type
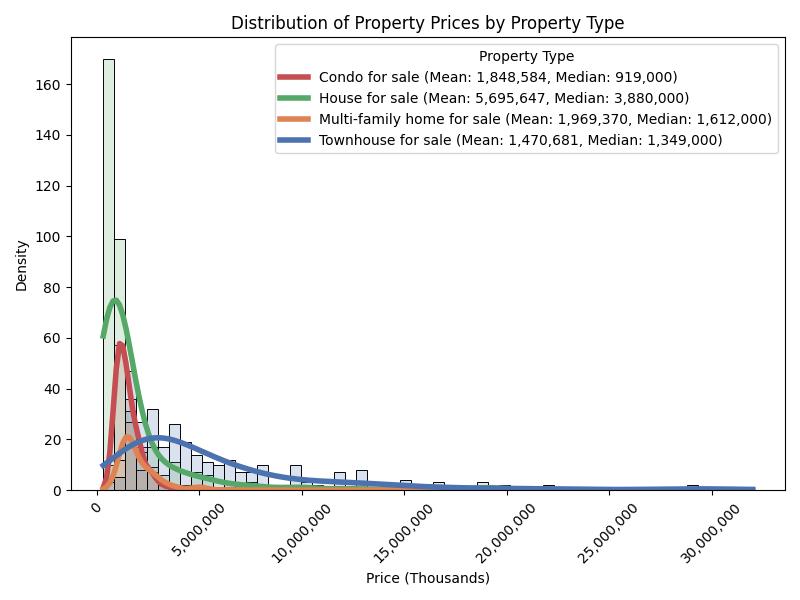
Following the overall market trend, the distribution of property prices is distinctly left-skewed, reflecting a concentration of lower-priced properties with a smaller proportion extending into the luxury segment. However, pricing dynamics vary significantly across property types, giving a complete view of the Vancouver real estate market. Houses stand out as the most expensive category, characterized by the highest median and mean prices, alongside a pronounced right skew that highlights a substantial share of high-priced listings. In contrast, condos feature lower median and mean prices and a less skewed distribution, indicating a more balanced and accessible price range.
Multi-family homes occupy the middle ground in terms of pricing, with moderate skewness suggesting a mix of both affordable and high-value properties. Townhouses, meanwhile, show relatively lower median and mean prices compared to houses, with a more evenly distributed price range that appeals to a broader demographic. These observations highlight the segmented nature of the market: houses predominantly serve high-end buyers, while condos and townhouses provide more affordable options. The presence of high-priced properties across all categories underscores the potential for luxury investment opportunities, making Vancouver's real estate market attractive to a diverse spectrum of buyers and investors.
Mean and Median Analysis by Property Type
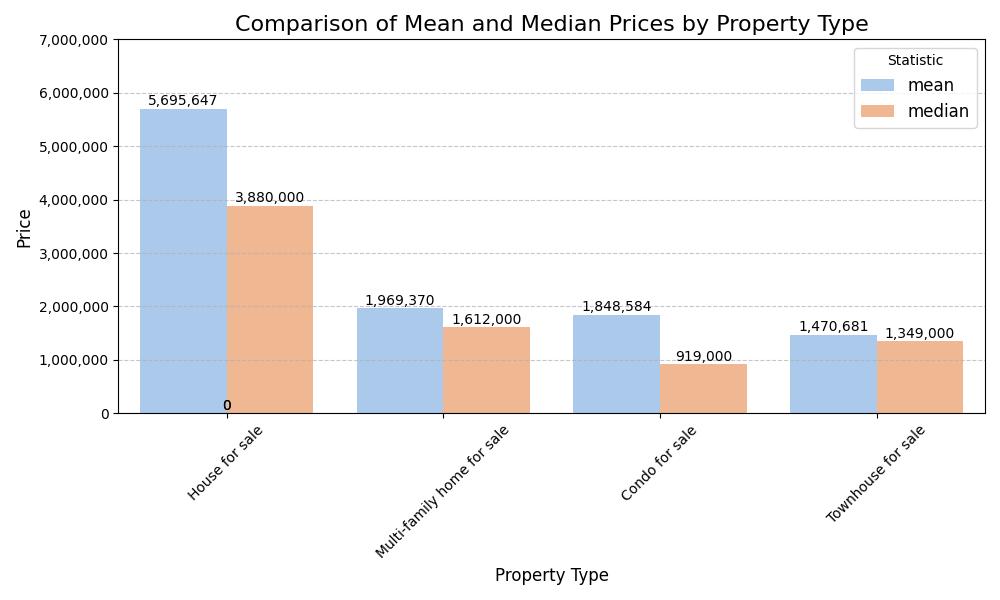
As previously noted, the mean serves as a useful reference point for identifying the average cost of a property within a specific segment. However, in a skewed distribution, this metric can be heavily influenced by extreme values, potentially misrepresenting typical pricing. In contrast, the median provides a more reliable measure, offering a clearer perspective on the central pricing trends without being distorted by outliers.
The following chart illustrates the mean and median prices grouped by property type, where houses represent the properties with the highest median with a price of 3.8 millions CAD, followed by multifamily homes and townhouses with median values of 1.6 and 1.3 million CAD respectively. The option that emerges as the most affordable are condos where the median price is 0.9 million CAD. This pricing landscape conveys a market with diversity that has various price ranges that adjust to different budgets. Leveraging this information can lead to more effective decision-making and stronger alignment with the financial profiles of diverse clientele.
Median Price for a House in Vancouver (CAD)
Median Price for a Condo in Vancouver (CAD)
Conclusion
This report has provided a comprehensive analysis of Vancouver's real estate market, highlighting key trends in property prices, distribution patterns, and geographical dynamics. Using data from Zillow and advanced analytical techniques, significant differences across property types were identified, pricing hotspots were pinpointed through heatmaps, and distinct market segments were uncovered using clustering analysis.
These findings offer valuable insights for buyers, investors, and urban planners, enabling more informed decisions and targeted strategies. By leveraging data-driven approaches, it is possible to navigate Vancouver's property market with greater confidence and precision.